It is a tool in your browser where you can write and run JavaScript commands, and helping you debug your code (known as debugging).
Console in browsers
Most browsers have their own console. The best for debugging are Chrome and Firefox. Nowadays most of browsers use Chrome as their browser engine like Arc, Brave, Vivaldi, etc. So most of browsers have similar basic functionality to the console.
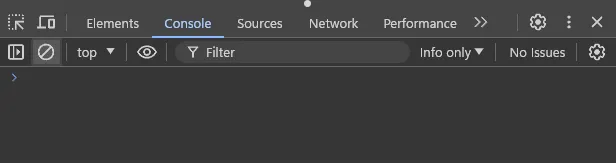
This is how a console looks like
Opening the console
Use keyboard shortcuts Command + Option + I on Mac and Ctrl + Shift + I on Windows to open the console. You can also navigate through the browser menu to do so.
Using the console
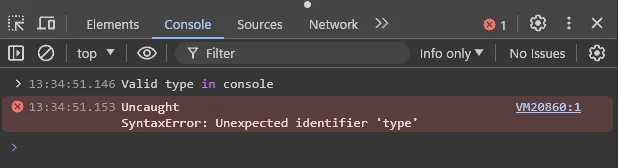
You can type JavaScript code directly into the console. If the code is valid, it will run and show the result. If it’s invalid, an error message will appear.
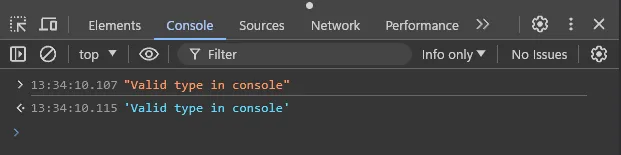
The difference between the two examples is the type of value entered. The first example uses a string, while the second example is detected as a variable
Displaying code in the Console
To display your JavaScript code in the console, use console.log("...").
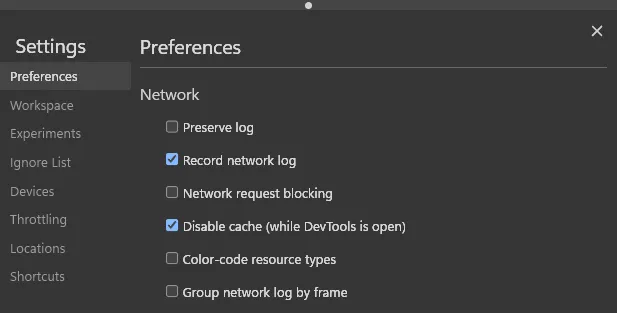
Errors and refreshing
If you see a ERR_FILE_NOT_FOUND error in the console, it usually means there’s a typo in your HTML file. Remember to
save any changes to your JavaScript file and refresh your browser to see the effects. Also, ensure to enable /
check Disable HTTP Cache in your console settings for changes to take effects.